Environment Setup for Windows Kernel Debugging with Windbg
28 Jun 2023Table of Contents
1. Introduction
2. Configuring your VM (debugee)
3. Configuring your dev/debugger environment
4. Windbg command cheatsheet
5. References
1. Introduction
I moved this article to my new blog. Click here to read it there.
In this blog post, I will describe how to set up an environment for kernel debugging in Windows and provide a WinDbg command cheatsheet.
I will reference some commands in subsequent posts to avoid repeating explanations.
When it comes to kernel debugging, it is crucial to understand that when a breakpoint is reached during the debugging process of an operating system, the entire OS freezes. Consequently, it becomes impossible to utilize a debugger within the same OS environment. Instead, a separate system is required, which connects remotely to the target OS undergoing debugging. This setup enables communication between the debugger and the target OS, ensuring that when execution is paused, your current OS remains unaffected.
2. Configuring your VM (debugee)
I am using VMware Workstation but other hypervisors should have similar options.
Kernel debugging with network communication (Recommended)
2.1. Install a Windows VM and create a snapshot of its clean state
2.2. Make sure the VM is using NAT networking
2.3. Find your Host OS IP address
2.4. Run the following powershell command in the VM and check the output for the VMs network interface
Get-NetAdapterHardwareInfo -InterfaceDescription * | select Name, InterfaceDescription, DeviceType, Busnumber, Devicenumber, Functionnumber | FL
// Example output
Name                 : Wi-Fi
InterfaceDescription : Qualcomm Atheros QCA61x4A Wireless Network Adapter
DeviceType           : PCI Express treated as PCI
Busnumber            : 8
Devicenumber         : 0
Functionnumber       : 0
2.5. Start the VM and run the following commands in CMD as an Administrator
bcdedit /debug on
bcdedit /dbgsettings net hostip:w.x.y.z port:50001 key:1.2.3.4
2.6. In the same Admin CMD run the command below substituting b.d.f with the values from the powershell output
bcdedit /set "{dbgsettings}" busparams b.d.f
// Example command
bcdedit /set "{dbgsettings}" busparams 8.0.0
Kernel debugging with named pipes for communication (Slow)
2.1. Install a Windows VM and create a snapshot of its clean state
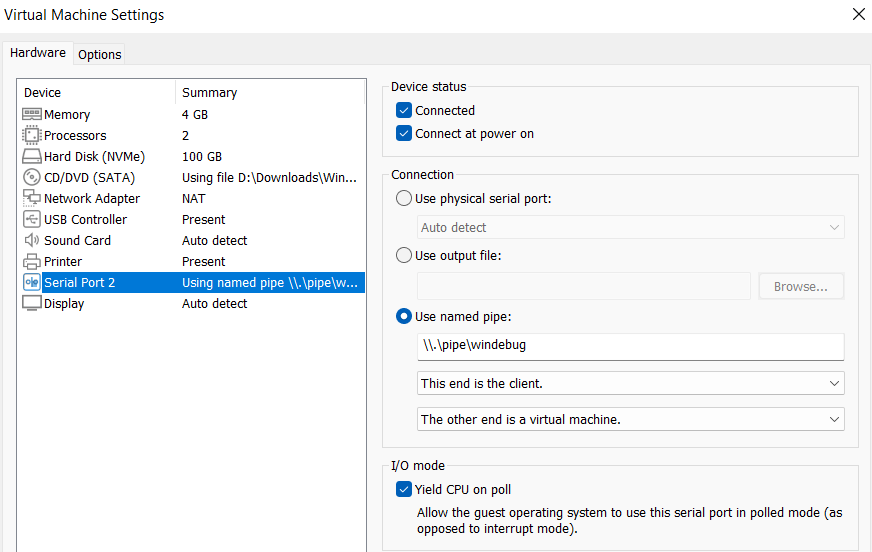
2.2. In VMware from the VM settings add a new Serial Port from Hardware > Add > Serial Port
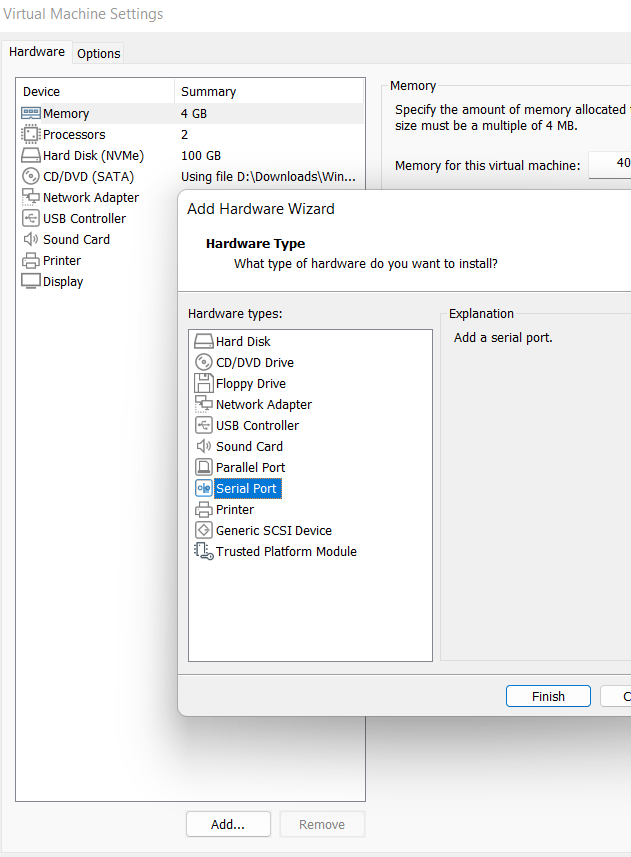
2.3. In the Serial Port configuration set the connection to use named pipe and choose a name for the pipe like \\.\pipe\windebug
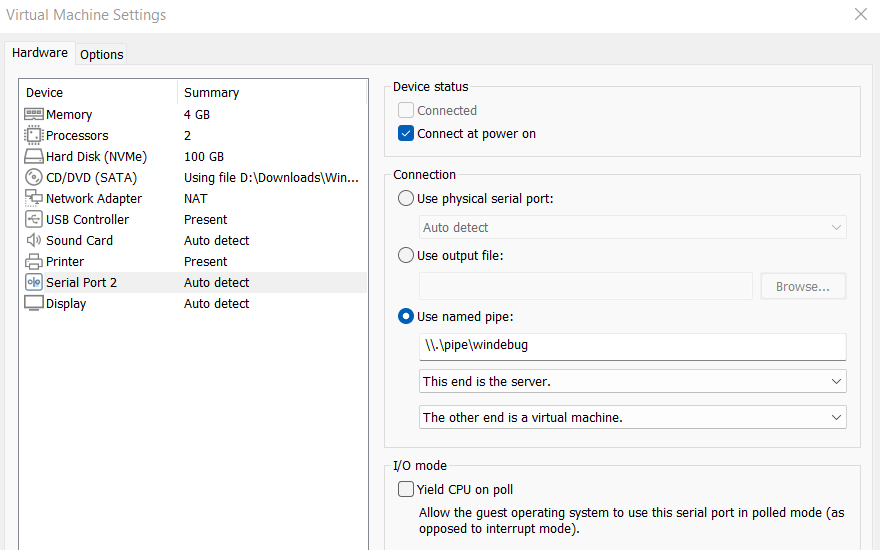
2.4. Take a note of the Serial Port number as you’ll need it later. In this case it’s 2
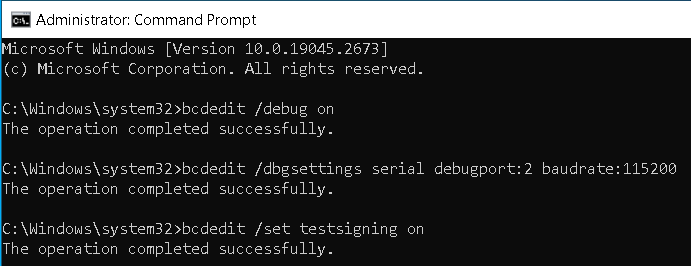
2.5. Start the VM and run the following commands in CMD as an Administrator
The debugport is the Serial Port number we saw from the VM settings.
bcdedit /debug on
bcdedit /dbgsettings serial debugport:2 baudrate:115200
The first command enables debugging in the boot configuration.
The second command specifies how the OS will communicate with the debugger.
If you plan to test your own drivers you can also execute:
bcdedit /set testsigning on
And if you want to disable driver integrity checks completely:
bcdedit /set nointegritychecks on
2.6 Power off the VM and create another snapshot
3. Configuring your dev/debugger environment
3.1. Install latest Visual Studio with the Desktop development with C++ workload
3.2. Install Windows 11 SDK
3.3. Install Windows 11 WDK
3.4. If WDK installation prompts you to install Visual Studio extension - agree and install it.
For all above-mentioned steps, head over to the following page and follow the steps:
https://learn.microsoft.com/en-us/windows-hardware/drivers/download-the-wdk
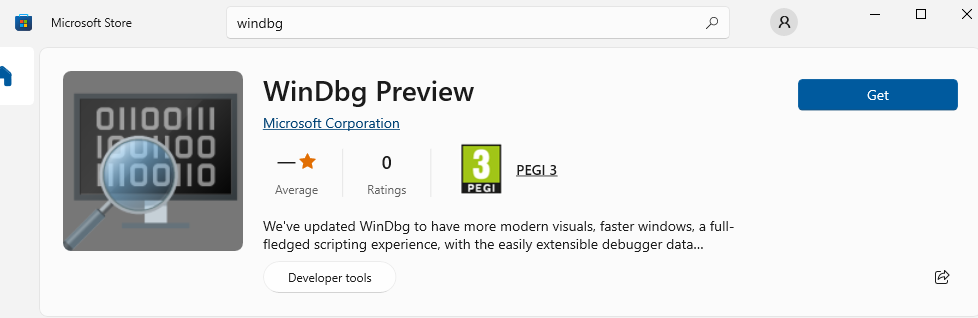
3.5.1. Go to this page to download and install the newest Windbg
3.5.2. Another way is to go to the Windows store and install “Windbg Preview”, but this version won’t be supported anymore
This is the new Windbg with modern GUI and new features
3.6.1. If using network communication, go to File > Attach to kernel > Net and fill in the key and port number
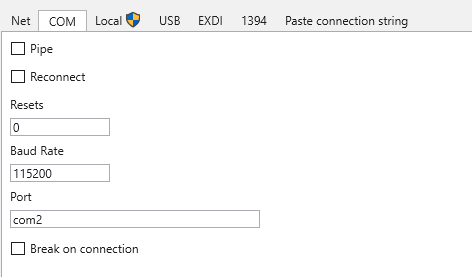
3.6.2. If using named pipes, go to File > Attach to kernel > COM, fill in the pipe name we chose for the Serial Port in the port filed and the same Baud Rate
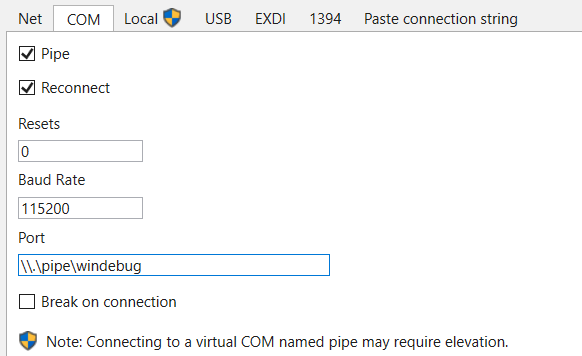
3.7. Click OK and Windbg should start waiting for connection
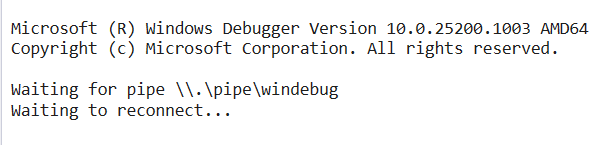
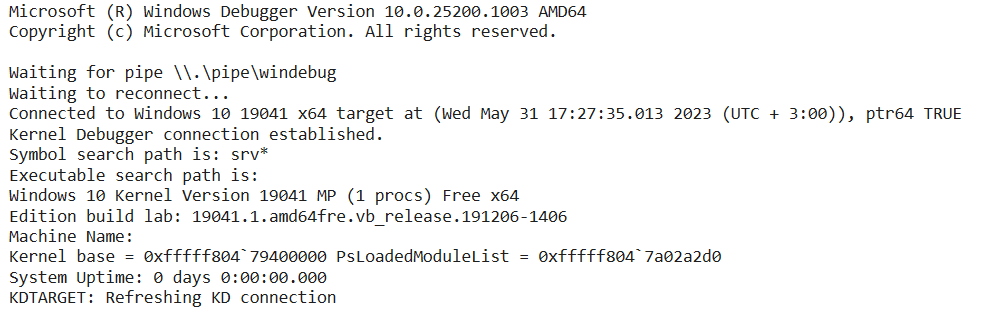
3.8. Start your VM and your debugger should connect
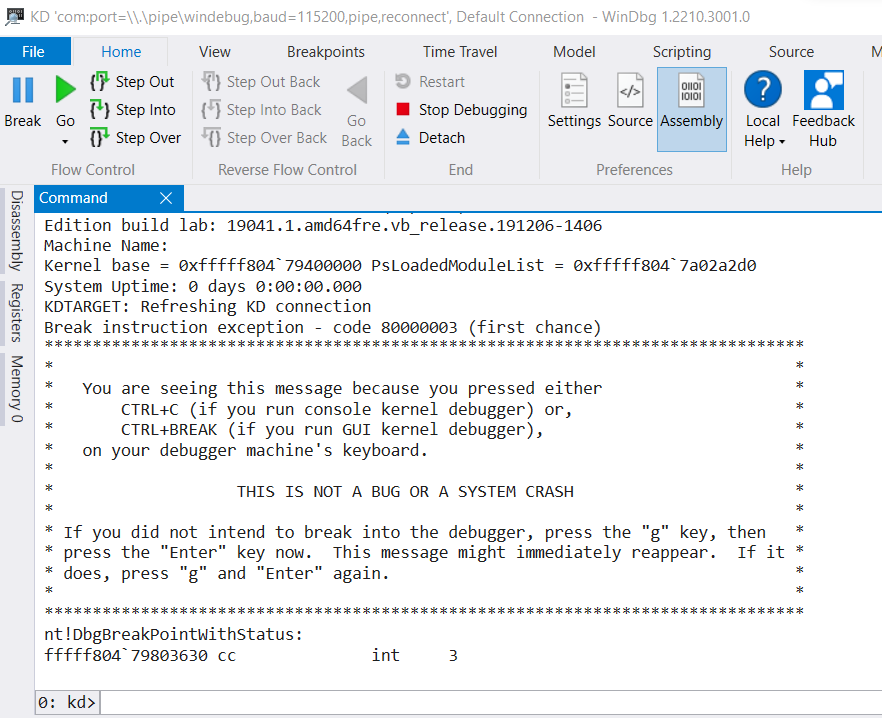
3.9. If you press the Break button, the debugger will break execution of the OS and you’ll be able to issue windbg commands
3.10. If your debugger environmnet is also in a VM, and you want to configure kernel debugging between two VMs you’ll need the same Serial Port VM settings for the debugger VM but with minor differences.
Set the Serial Port as client.
Run Windbg with default COM settings, but specifying the COM port number as the Serial Port number.
4. Windbg initial steps
After connecting to the debugged kernel, the first commands which are useful to use in windbg are:
!sym noisy // makes the symbol loading more verbose. Helps to troubleshoot any problems with the symbol loading
.symfix    // automatically sets the symbol path to point to the Microsoft symbol store
.reload    // deletes all symbol information and reloads the symbols as needed
5. Windbg command cheatsheet
Windbg has a lot of commands. Here I will list only those which might be useful for these blog posts.
Windbg commands can be separated in 3 categories:
- Regular commands (dd, dt, x). Used for debugging
- Meta (dot) commands. They are used to control the behavior of the debugger
- Extension commands. They start with ! (!analyze, !peb, !teb). Implemented as functions part of extension DLLs.
To abort long-running comand use Break button or Ctrl+Break.

Virtual pseudo-registers provided by windbg start with dollar sign $:
$ra - return addrs on stack
$ip - instruction pointer
$peb - address of PEB
$teb - address of TEB

Referencing registers in an expression should be preceded with @ sign.
eax is the same as @eax
@peb is the same as @$peb

poi(<addr/symbol>) - dereference a pointer
Each symbol is treated as an address (the value of a symbol is its memory address).
To get the value of the symbol held at its address it has to be dereferenced.

? - display regular commands
.help - display dot commands
.help a* - display dot commands starting with a
? <expression> - evaluate an expression
? 5+5
!Ext.help - list general extensions

ld <modulename> - load symbols for module
ld kernel32

x Module!Symbol - Examine symbols
x /t Module!Symbol - also show data type
x /v Module!Symbol - verbose (show type and size)
x *! - list all modules
x ntdll!*  - list all symbols of ntdll
x kernel23!*LoadLibrary* - list all symbols containing LoadLibrary

ln <address> - list symbols near that address. Also displays their addresses

lm[Option] - list modules
   v - verbose
   l - with symbols
   k - only kernel symbols
   u - only user symbols
   f - show image path
   m [pattern]

lm - list all loaded and unloaded modules, and their addresses
lmv m kernel32 - show information about kernel32 module
lm m nt - show information about the kernel (ntoskrnl.exe) module

!lmi - detailed info about a module
!lmi kernel32

!dh <address> - display PE headers at address
!dh -f <address> - file headers only
!dh -s <address> - section headers only
!dh -e <address> - exported functions

r - dump all registers
r eax, ebx,... - dump only specific registers
r $peb - dump address of PEB ($peb is pseudo-register)
r $teb - dump address of PEB ($peb is pseudo-register)

!peb - display formatted view of the PEB
!teb - display formatted view of the TEB

dt [Module!]SymbolName - dump variable info (local variable, function parameter, global variable or data type)
dt [Module!]Sym* - list symbols starting with Sym
dt [Module!]SymbolName -v - verbose (address and type)
dt ntdll!_PEB - show the PEB structure
dt ntdll!_PEB <address> - dump PEB structure found at specified address
dt ntdll!_PEB @$peb - dump PEB of current process
dt nt!_EPROCESS
dt nt!_EPROCESS poi(nt!PsInitialSystemProcess)
dt nt!_ex_fast_ref poi(PsInitialSystemProcess)+4b8

!address <address> - display information about the memory at the specified address
!address esp

d* <address> - display memory at address
db - byte
dw - word
dW - word + ascii
dd - dword
dc - dword + ascii
dq - qword
da - ascii
du - unicode
db <addr> - display 1 byte at specified address
dd <addr> L3 - display 3 dwords

dyb <addr> - binary + byte
dyd <addr> - bynary + dword

d*s <address> - display words and symbols at address; Address is assumed to be a series of addresses in symbol table
dds - dwords
dqs - qwords
ddp - display referenced memory

dx - Display C\C++ Expression
dx @$systemProc = *(nt!_EPROCESS**)&nt!PsInitialSystemProcess  - dereference and cast PsInitialSystemProcess as EPROCESS structure
dx (char*)@$systemProc->ImageFileName  - print ImageFileName field from systemProc structure

uf <address> - unassemble function
uf /c <address> - show only function calls
u <address> L300 - unassemble and limit to 300 assembly instructions

!process 0 <Flags> [ImageName] - list information about process
!process 0 0 - list all processes
!process 0 0 cmd.exe - show information about process cmd.exe
!process -1 0 - current process context
!process 0 1 cmd.exe - get more inforation about the process cmd.exe (including token address)
!process 0 1 system - get information about the system process

.process /i /p <address> - change context to the process at <address>

!token <address> - info about process token

!pte <VA> - convert Virtual Address to Physical Address

!vtop <DirectoryTableBase> <VirtualAddress> - translate VA to Physical address. Needs to be in the context of a process. Lowest 3 nibbles of DirectoryTableBase need to be zeroed-out

rdmsr <msr index> - read the value of MSR register

s -[option] <start_addr> <end_addr> <data_to_search> - search in memory
s -b - search bytes
s -a - search ascii
s-b <start addr> <endaddr> 4d 5a 90 00 - search MZ in a region
s -a @rsp L10000000 "B7"

Useful NTOSKRNL Symbols
nt!PsInitialSystemProcess - SYSTEM EPROCESS pointer
nt!PsLoadedModuleList - Loaded modules in kernel (_LIST_ENTRY)
nt!PspNotifyEnableMask - Flag which can disable kernel notify routines
5. References
- http://windbg.info/doc/1-common-cmds.html
- http://windbg.info/download/doc/pdf/WinDbg_A_to_Z_color.pdf
- https://github.com/hugsy/defcon_27_windbg_workshop/blob/master/windbg_cheatsheet.md
- https://github.com/repnz/windbg-cheat-sheet
- https://github.com/alex-ilgayev/windbg-kernel-debug-cheat-sheet
- https://juniper.github.io/contrail-windows-docs/For%20developers/Debugging/Kernel_Debugging/
- https://learn.microsoft.com/en-us/windows-hardware/drivers/debugger/setting-up-a-network-debugging-connection
- https://learn.microsoft.com/en-us/windows-hardware/drivers/debugger/